
SenseNova-U1-8B-MoT-Infographic – SenseTime's Open-Source Infographic-Enhanced Model

Executive Summary:
SenseNova-U1-8B-MoT-Infographic is SenseTime's open-source infographic-enhanced model built on the unified SenseNova-U1-8B-MoT architecture at 8B parameters. Through targeted data training and reinfor...
1. What Is SenseNova-U1-8B-MoT-Infographic
SenseNova-U1-8B-MoT-Infographic is SenseTime's open-source infographic-enhanced model built on the unified SenseNova-U1-8B-MoT architecture at 8B parameters. Through targeted data training and reinforcement learning (RL), it improves dense small-text rendering, layout stability, and chart data correctness without degrading visual understanding. It generates posters, charts, recipes, arXiv-style academic pages, and other complex infographics—filling a gap in open-source precise infographic generation. Weights and code are fully open with consumer-GPU deployment for reproducible, customizable high-quality infographic workflows.
Technical positioning and domain: Multimodal generation focused on infographics—dense text, complex layouts, chart consistency—not generic text-to-image. Native unified architecture with MoE/MoT merges text and pixel generation, positioning it as the open community's first infographic-specialized enhancement.
Research background: From SenseTime's research team on the SenseNova-U1-8B-MoT base, with deep CV/multimodal experience. Motivation: generic image models blur small text, break layouts, and hallucinate chart numbers. Infographic-specific RL plus MoT decoupling targets these issues while preserving general vision understanding.
Core value: Moves open infographic generation from "usable but unreliable" to production-grade. Posters and charts once needed heavy manual fixes—footnotes illegible, values invented. This model raises small-text accuracy, stabilizes layout, and enforces chart consistency while keeping understanding intact—lower design and QA cost for marketing, papers, and reports.
Technical characteristics: NEO-Unify native unified architecture—pixel-token unified space instead of vision-encoder + VAE stitching. MoT (Mixture-of-Transformers) shares context at the bottom with decoupled parameters; text and vision routes dynamically to avoid gradient interference. Four-stage progressive training (understanding warm-up → generation pretrain → unified mid-training → unified SFT) plus infographic RL (small-text reward, layout stability reward, chart consistency constraints).
2. Key Features
Dense small-text rendering: RL reward functions optimize footnotes, table notes, legal disclaimers at very small point sizes—6pt Chinese/English readable without smearing or garbling vs. generic models.
Complex layout stability: Posters, recipes, comparison tables with grids, columns, hierarchy—structure loss and layout datasets keep elements aligned, non-overlapping, proportionally correct (e.g., arXiv-style title/author/abstract placement).
Chart data correctness: Consistency constraints cross-check numeric labels during training—bar heights match values, pie slices sum to 100%, fewer hallucinated numbers.
arXiv-style academic pages: Single-column title, dual-column body, footnotes, page numbers, side watermarks from title, authors, abstract, and body text—preprint previews and paper posters.
Multi-type infographic coverage: Posters, flowcharts, comparison tables, postcards, recipes, manuals, and more—type-specific training preserves visual norms (numbered steps and ingredient lists on recipes).
Visual understanding preserved: MoT decoupling optimizes pixel flow-matching in the generation branch while text autoregression and shared attention stay intact—captioning and VQA match the base model without catastrophic forgetting.
3. How to Use
Environment: Python 3.10+, PyTorch 2.1+, CUDA 12.1+. Clone from Hugging Face and
pip install -r requirements.txt(Transformers, Diffusers, accelerate, sentencepiece, etc.). RTX 4090 24GB or similar recommended.Download weights:
git lfs install && git clone https://huggingface.co/sensenova/SenseNova-U1-8B-MoT-Infographicorfrom_pretrained. ~16GB FP16 weights—reserve ~30GB disk.Load model:
from diffusers import DiffusionPipeline
pipe = DiffusionPipeline.from_pretrained("sensenova/SenseNova-U1-8B-MoT-Infographic", torch_dtype=torch.float16)
pipe.to("cuda")
First load may compile graphs (~1–2 min).
device_map="auto"for multi-GPU.Prompt and generate: Include infographic type, content structure, text requirements, layout style, e.g.:
"A scientific poster about climate change, with title 'Global Warming Trends', three columns: left column shows a bar chart of CO2 emissions, middle shows a line graph of temperature rise, right column lists key solutions. Use sans-serif font, footnotes in 8pt at bottom."Resolution 1024×1024 or higher; 50–100 steps; CFG scale 7.5. Upscale or locally refine as needed.
Post-processing: Upscale with Real-ESRGAN for print. OCR (e.g., PaddleOCR) can verify small text; locally regenerate blurry regions.
Tips: FP16 ~16GB VRAM—use
pipe.enable_attention_slicing()orpipe.enable_model_cpu_offload()if tight. Chinese renders well; mix Chinese content with English layout terms ("two columns", "8pt footnotes") for best structure control.
4. Pros and Cons
| Pros |
|---|
| Small-text breakthrough: RL-tuned 6pt dense CN/EN text—footnotes and table notes far exceed generic models. |
| Stable layout + accurate charts: Grids/columns stable; chart numbers hallucinate far less—suited to business and academic accuracy needs. |
| Fully open: Apache 2.0 weights/code—commercial and academic fine-tuning (medical posters, engineering diagrams). |
| Understanding intact: MoT decoupling—one model for generation and understanding tasks. |
5. Comparison with Similar Tools
| Dimension | SenseNova-U1-8B-MoT-Infographic | Ideogram 3.0 | DALL-E 3 |
|---|---|---|---|
| Architecture | NEO-Unify + MoT dynamic routing | Proprietary diffusion Transformer | Closed CLIP + diffusion |
| Parameter scale | 8B MoT | Undisclosed (~100B class est.) | Undisclosed |
| Open source | Weights + code (Apache 2.0) | Closed API | Closed API |
| Small-text accuracy | RL-specialized 6pt readable | Industry-leading poster text; less small-footnote focus | Often blurry/wrong small text |
| Layout stability | Grid/column/hierarchy optimized | Controllable but not infographic-structural | Random; many retries |
| Chart correctness | Consistency constraints; rare numeric hallucination | Aesthetic focus; average data precision | Frequent data errors |
| Academic layout | arXiv single + dual column | Not supported | Not supported |
| Deployment | Local ~16GB VRAM | Cloud API | Cloud API |
Selection advice: Open, controllable, strict infographic quality (academia, data viz teams) → SenseNova-U1-8B-MoT-Infographic. Budget for best headline/logo text via API → Ideogram 3.0 (less structural infographic focus). Budget generic images, manual fixes OK → SDXL + ControlNet. Fast prototypes, not batch precision → DALL-E 3.
6. Editor's Take
MoT + infographic RL is the technical headline—shared Transformer for autoregressive text and pixel flow matching without encoder–diffusion semantic gaps; generation branch strengthens without forgetting understanding. Four-stage training builds base capability before unified SFT.
Practical impact: fixes blur, layout chaos, and data hallucination—less post-OCR repair and spreadsheet checking. arXiv-style pages fill an open LaTeX-like gap for posters and preprint previews.
Audience: researchers, data viz engineers, marketing designers, educators—open weights run on consumer GPUs.
Future: more template types, faster inference via distillation to ~8GB VRAM, deeper CJK layout prompt understanding.
— −0.5 for VRAM and Chinese layout prompts; benchmark open infographic generation today.
7. Use Cases
Marketing and brand: Posters, long images, comparison tables from copy + brand colors—legal disclaimers and spec tables accurate.
Academic publishing: arXiv-style pages and comparison tables from title/abstract/chart data—fix formula/footnote blur pain points.
Business reports: Financial charts, strategy flowcharts, market decks with bar/pie consistency for executive use without manual numeric audit.
Education: Course concept maps, textbook illustrations, lab step diagrams with clear Chinese labels for print and online.
Life services: Menus, postcards, recipe steps, event schedules—readable Chinese details (quantities, phone numbers).
8. FAQ
Q: Main advantage over SDXL?
A: Infographic specialization—small text, layout, chart correctness production-ready vs. SDXL's frequent blur and random data.
Q: Chinese support?
A: Trained on CN/EN; 6pt Chinese readable. Mix CN content + EN layout terms in prompts for best structure.
Q: Consumer GPU smoothness?
A: ~16GB FP16; RTX 4090 ~15–20 s/image; RTX 3060 needs offload (~30–40 s). Prefer 24GB+ for interactive use.
Q: Domain fine-tuning (medical, engineering)?
A: Apache 2.0—LoRA/full fine-tune on domain data; preserve MoT routing to avoid breaking decoupling.
Q: Max resolution / print?
A: Generate 1024²–2048²; upscale 2–4× with Real-ESRGAN for 300 DPI print. VRAM scales with resolution².
Q: Complex math on academic pages?
A: Common integrals/matrices OK; rare symbols may distort—overlay MathJax-rendered formulas for critical math.
9. Project Links
- Hugging Face: https://huggingface.co/sensenova/SenseNova-U1-8B-MoT-Infographic
- SenseTime blog: https://www.sensetime.com/cn/news/detail/xxxx (placeholder—watch official channels)
Related AI Model Articles
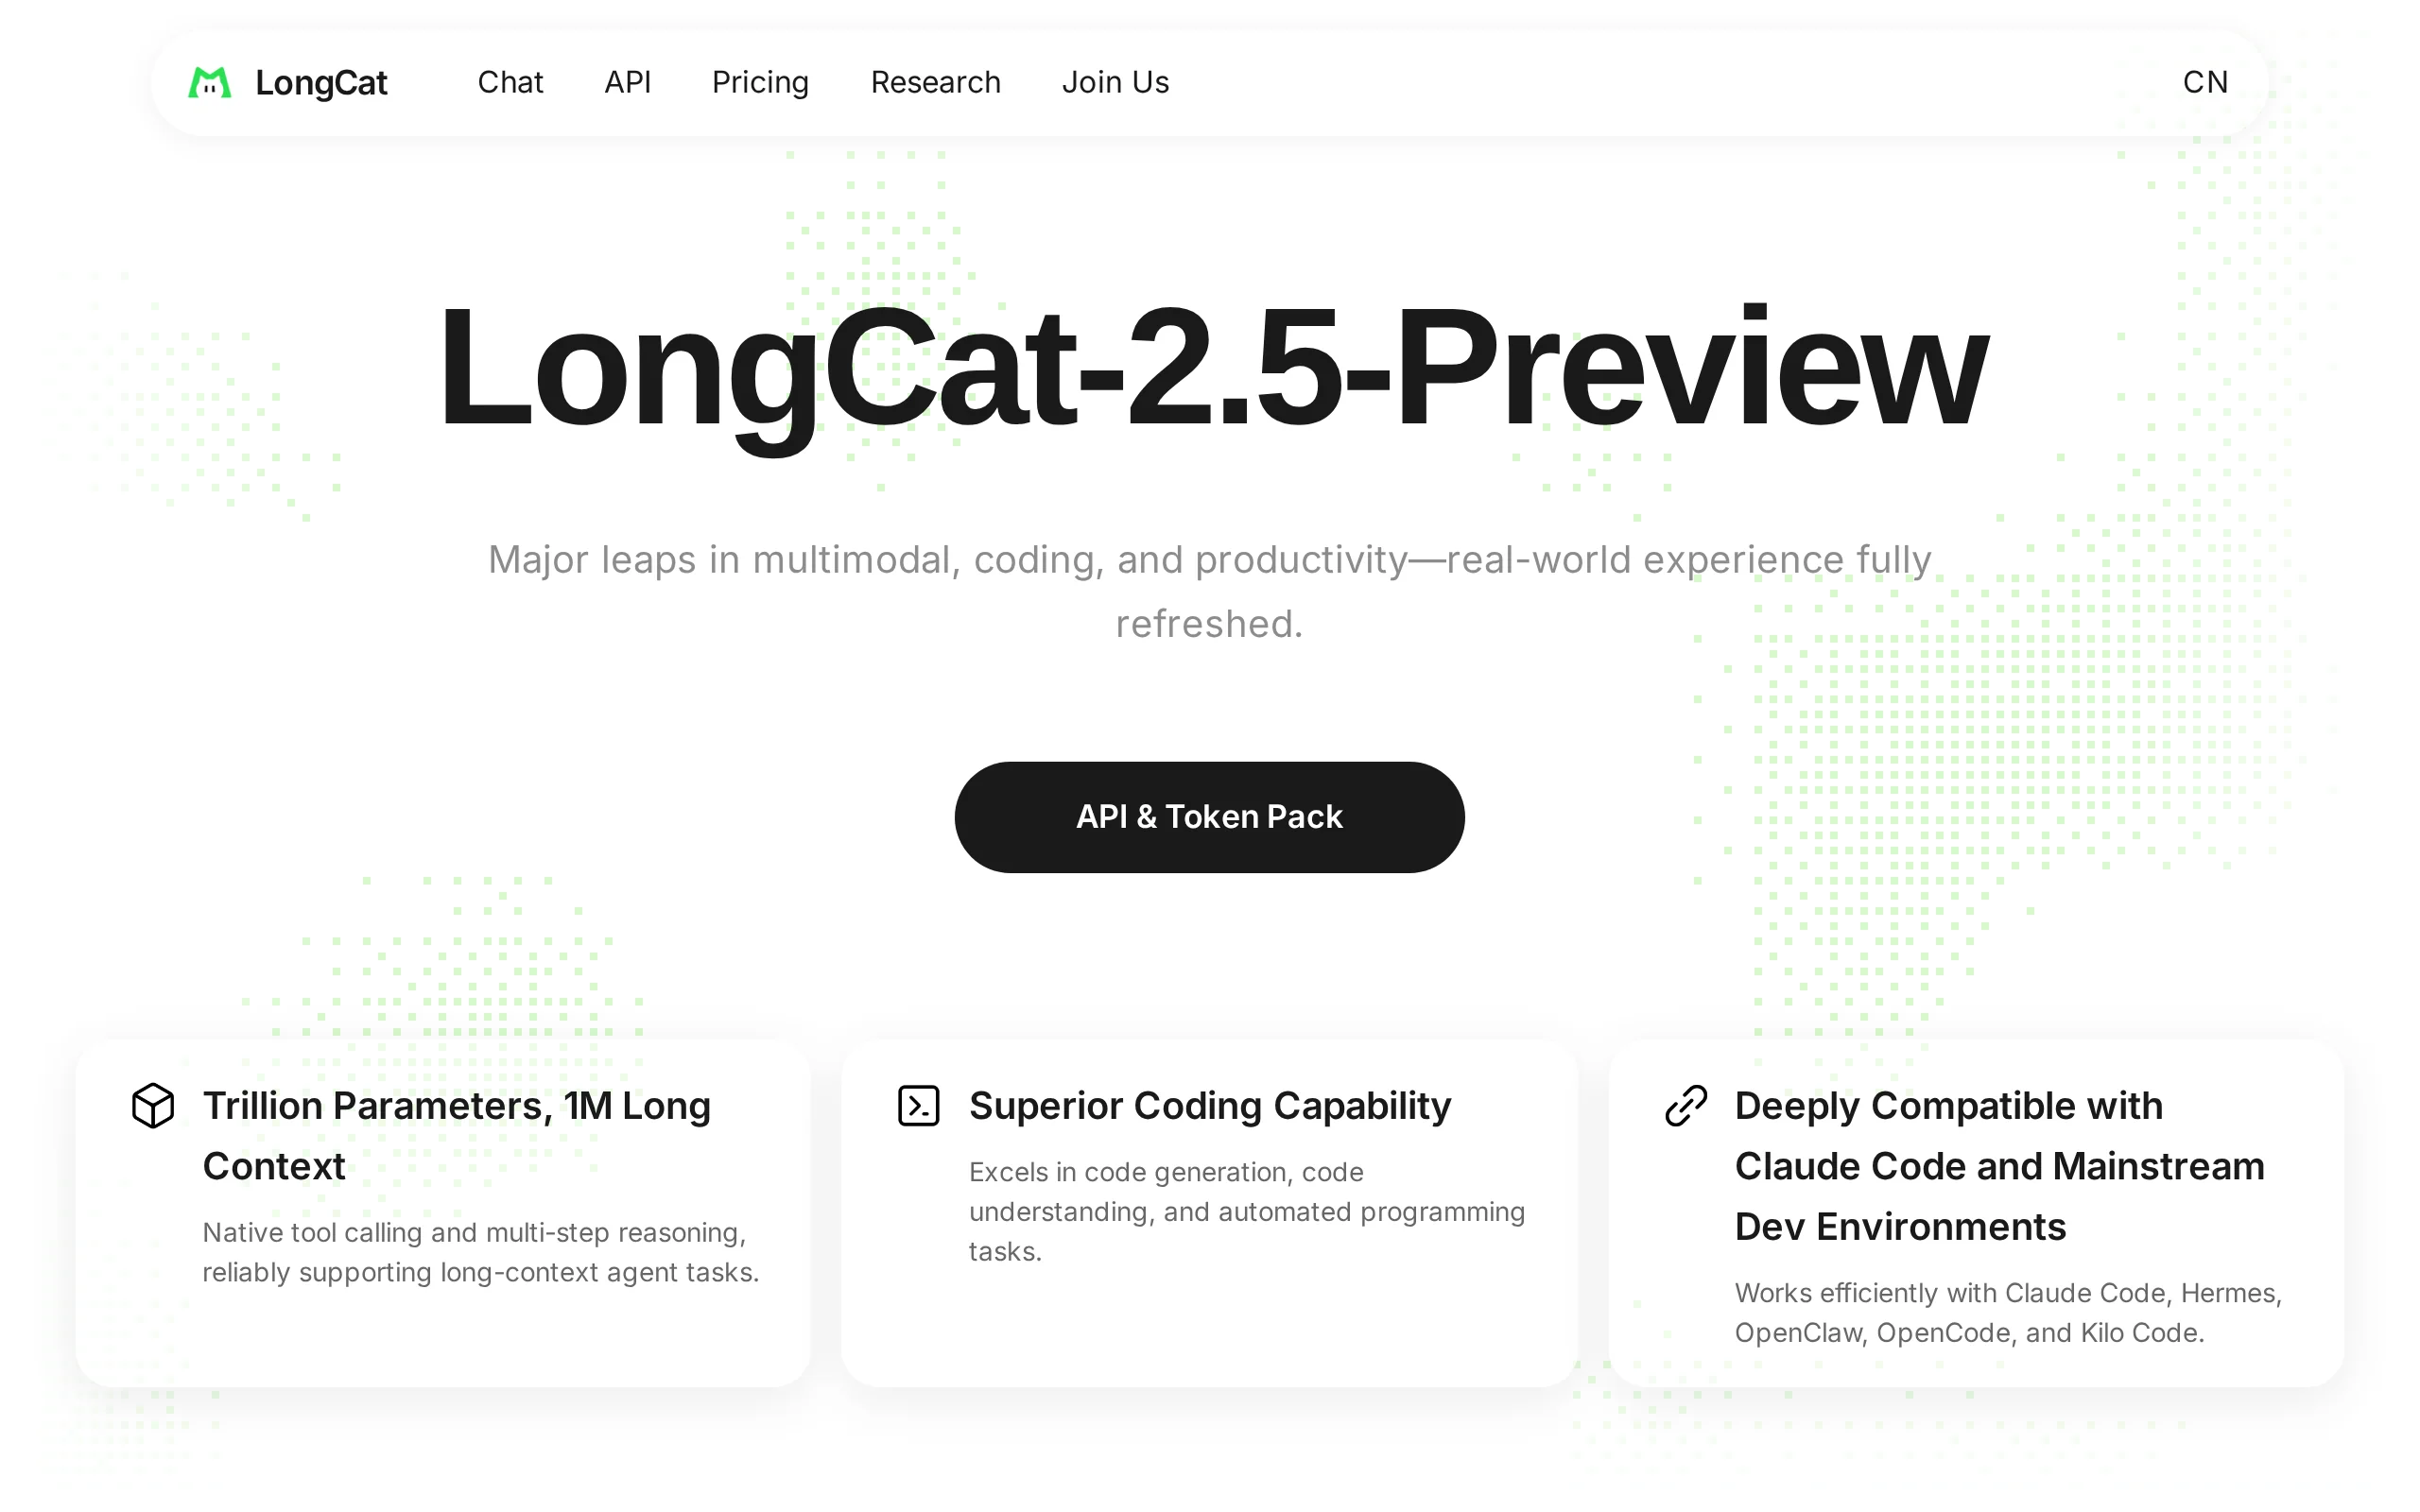
In-Depth Review of Longcat-2.5-preview: Meituan's Next-Generation Multimodal Long-Range Agent Model
LongCat-2.5-preview is Meituan's latest next-generation large model. Building upon the 1.6T total parameters, approximately 48B active parameters, and native 1M token context of LongCat-2.0, it marks ...
Xiaomi MiMo-V2.6 – Xiaomi's Open-Source Multimodal Model Series
Xiaomi MiMo-V2.6 is a series of fully multimodal models released and open-sourced by Xiaomi, comprising two native full-modal models: Pro and Flash. It is centered on large-scale Agentic reinforcement...
In-Depth Review of Step 5 Preview: A 600B Sparse MoE Flagship with 1M Token Context and 1/8 Cost Advantage
Step 5 Preview is a new-generation flagship foundation model launched by StepFun, designed for real-world Agentic tasks. Based on a sparse MoE architecture, the model has a total of 600B parameters bu...
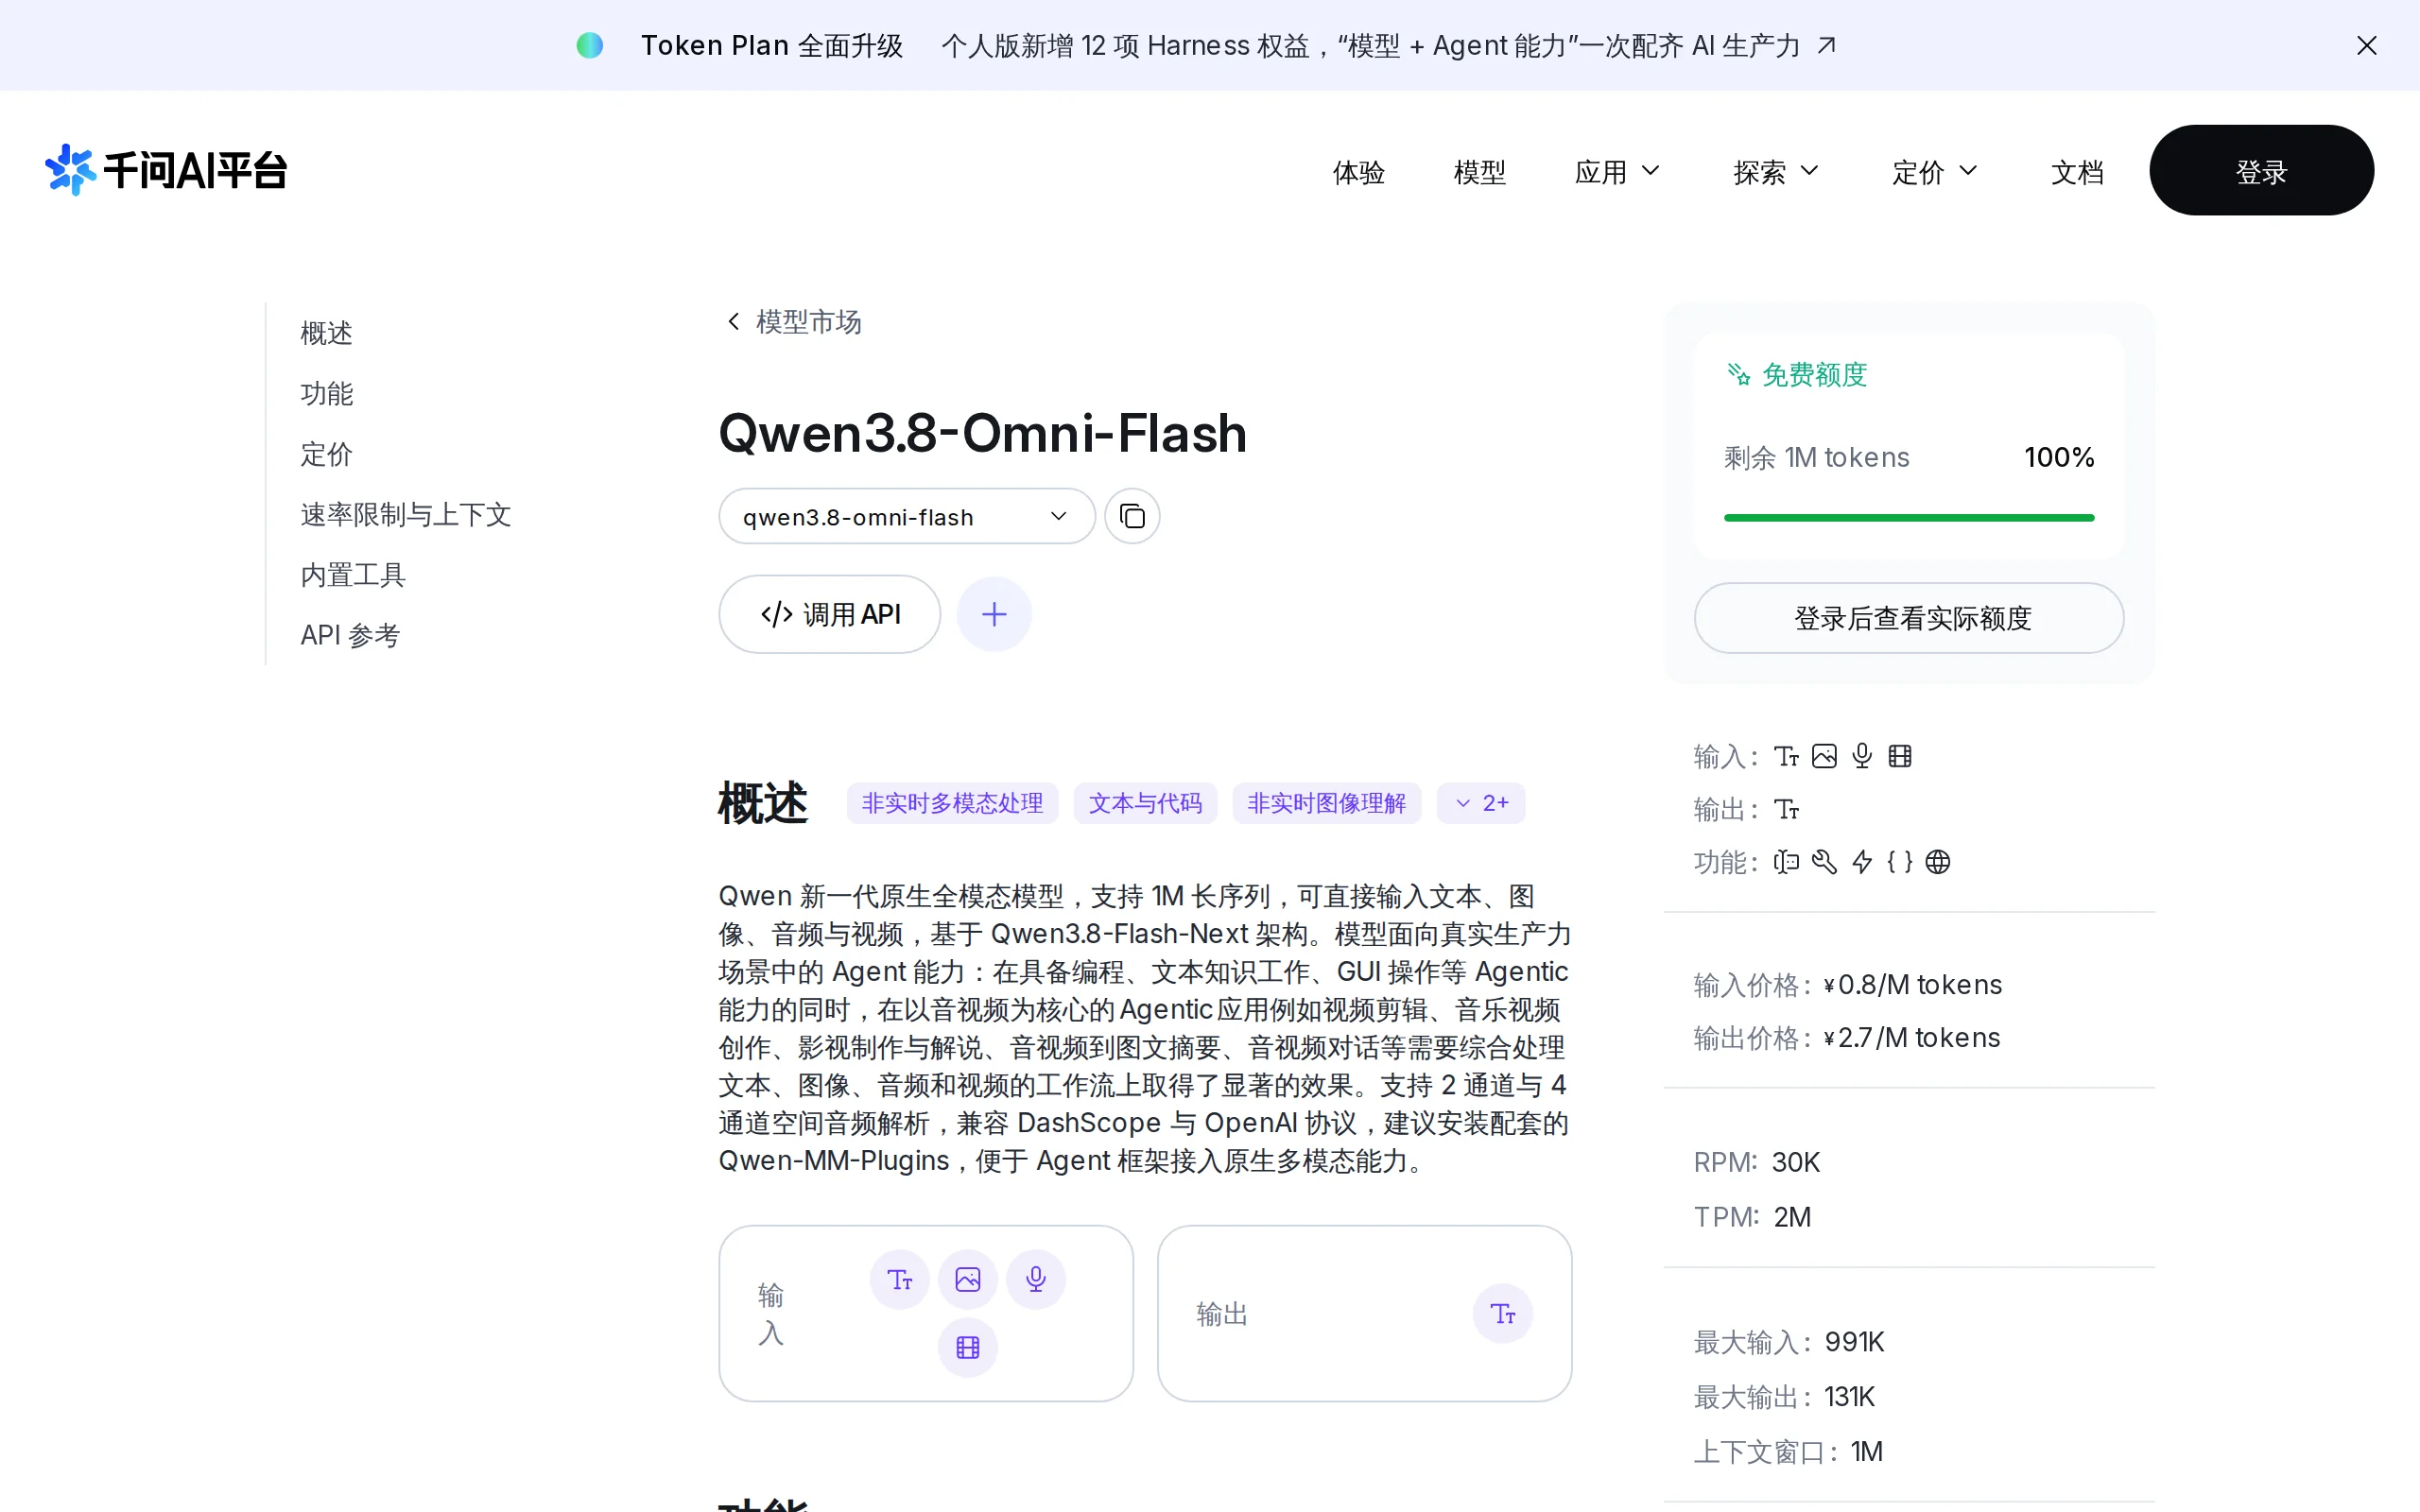
Qwen3.8-Omni-Flash – A Native Multimodal Model Launched by Alibaba Qwen
Qwen3.8-Omni-Flash is a native multimodal model launched by Alibaba Qwen. It jointly models four modalities—text, image, audio, and video—within a single architecture, supporting a context length of u...
© All Rights Reserved. Some content on this site is partially generated by AI with human review.