
In-Depth Review: Huashu's Open-Source AI Data Analysis Skill, Using an 8-Step Process to Eliminate 'Silent Errors in Calculations'
Executive Summary:
huashu-excel is an open-source AI data analysis Skill developed by Huashu, addressing the core issue of "silent errors in calculations" through an eight-step workflow: Inspection → Cleaning → Alignmen...
1. What is huashu-excel
huashu-excel is an open-source AI data analysis Skill developed by Huashu, addressing the core issue of "silent errors in calculations" through an eight-step workflow: Inspection → Cleaning → Alignment → Analysis → Reconciliation → Delivery → Image Verification → Quality Control. This tool leverages openpyxl to identify structural traps in raw cells, employs internal summary rows as built-in checksums for reconciliation, and deploys an independent agent to re-calculate and cross-verify results. It supports HTML/Excel/Word report outputs with minimal dependencies—only openpyxl is required—and is open-sourced under the MIT license.
Technical Positioning & Domain:
huashu-excel belongs to the data analysis tool category within the AI Agent ecosystem, operating at the intersection of natural language processing and data engineering. Unlike traditional end-to-end data analysis models, it does not replace analysts directly but instead injects an executable data analysis methodology into coding agents like Claude Code, Cursor, and Codex. This enables agents to complete inspection, cleaning, analysis, reconciliation, and delivery workflows after reading tables, transforming human audit rigor into automated processes.
Development Context:
Created and open-sourced by Huashu (GitHub: alchaincyf), this tool emerged from long-term observations of AI Agent implementation quality in real-world business scenarios. The developer identified a widespread issue with LLMs in data analysis contexts: models often silently output seemingly reasonable results when calculation errors occur, without actively flagging them. huashu-excel is a methodology encapsulation designed to address this pain point, converting audit logic into automatically executable process gates to ensure every analysis is traceable and errors are explicitly reported.
Core Value Proposition:
This tool resolves three layers of challenges in AI-driven data analysis:
- Structural Pitfalls – Identifies issues like merged cells, misplaced subtotal rows, and misaligned headers before dynamic table processing in pandas.
- Calculation Errors – Achieves reconciliation through internal summary rows as built-in checksums, enforcing row-count consistency and sum consistency.
- Conclusion Reliability – Validates analytical outcomes by having an independent agent re-calculate from raw data. The result is a "no delivery without reconciliation" principle, transforming AI data analysis from silent error propagation to explicit error reporting.
Technical Features:
huashu-excel's core technical advantages lie in its minimal dependency stack and auditable workflow design. The entire tool relies on a single openpyxl library, eliminating dependencies on pandas, visualization libraries, or internet connectivity. HTML reports are implemented with inline SVG hand-drawn diagrams for offline accessibility. Furthermore, SKILL.md itself functions as a methodology document, making all cleaning steps replayable and auditable. Its cross-agent platform compatibility allows flexible adaptation to diverse business scenarios.
2. Key Features
Data Health Check: Directly reads raw cells using openpyxl to identify structural risks such as misaligned headers, merged cells, and subtotal rows mixed in before pandas conversion. This mechanism prevents destructive reading of raw data, ensuring subsequent analysis is built upon complete data structures and reducing misjudgment risks at the source.
Data Cleaning: Converts dirty tables into standardized analysis tables while generating auditable, replayable cleaning scripts. Each operation's impact on row count is explicitly recorded, ensuring transparency in the cleaning process and providing comprehensive evidence for accountability and reuse, making data processing no longer a black-box operation.
Requirement Alignment: First assesses data characteristics and external benchmarks, then confirms actual user requirements and analysis criteria. This step prevents "solving an entire analysis with incorrect questions" from the outset, reducing ineffective work and ensuring subsequent analysis aligns with business objectives, thereby enhancing the practicality of delivery outcomes.
Data Analysis: Scans common data pitfalls such as Simpson's paradox, ghost grouping, small sample sizes, and time discontinuities, and extrapolates findings to the "so what?" level. This feature not only identifies data anomalies but also explains their underlying business implications, helping users extract actionable insights rather than remaining at the surface level of numbers.
Numerical Reconciliation: Uses cleaned detail rows to verify against the built-in "total" rows in the original table, transforming the true values calculated by the original table author into free checksums, and exposing manual entry errors and criterion discrepancies. This is one of the tool's most distinctive capabilities, achieving low-cost, high-efficiency cross-validation through the original table's self-contained verification information.
Report Delivery: Outputs three formats: self-contained HTML (with inline SVG for offline access), native Excel (charts dynamically linked to data), and a six-page narrative Word report. Different formats cater to web sharing, data interactivity, and formal presentations, meeting diverse delivery requirements.
Chart Validation: Checks for SVG rendering issues such as out-of-bounds placement, overlaps, occlusions, and dual-axis misdirections, ensuring charts are honest and colorblind-friendly. Based on the Cleveland & McGill perceptual accuracy hierarchy, it selects visual encodings; rejects pie charts for categories exceeding three, and enforces zero-based bar axes, eliminating misleading expressions at the visual level.
Independent Quality Control: Assigns an independent agent who did not participate in the creation process to recalculate results from raw data, specifically challenging and verifying conclusion reliability. This mechanism effectively addresses systematic biases like "internal consistency but overall error spanning an entire fiscal year," providing independent credibility assurance for final delivery conclusions.
3. How to Use
Environment Requirements: Requires a Node.js environment (for executing npx commands) and any AI Agent client supporting the Skill mechanism, such as Claude Code, Cursor, Codex, or Kimi Code. The core script is implemented in Python, requiring Python 3.8 or higher and the openpyxl library installed.
Install the Skill: Install automatically via the command
npx skills add alchaincyf/huashu-excelor manually clone the repository into the Agent's skills directory. After installation, the Agent will automatically recognize the Skill's trigger conditions.Select the Installation Path: Choose the installation directory based on your Agent platform: Claude Code uses
~/.claude/skills/, Codex/Kimi Code uses~/.agents/skills/, and for project-level usage, follow the repository directory structure. Correct path configuration is essential for the Agent to load the Skill properly.Natural Language Invocation: Issue instructions directly in natural language, such as "Help me analyze this sales table," "Why don't these two numbers match?" or "Clean this table for me." The Agent will automatically match the corresponding workflow stages based on intent, eliminating the need to memorize complex commands.
Trigger Workflows on Demand: Ask for a single number to perform direct queries; request a full report to execute the eight-step workflow; or run only the inspection + cleaning process with replayable scripts when table cleaning is required. Users can flexibly select workflow depth based on task complexity to avoid over-processing.
Use Scripts Independently: Run scripts like
profile_table.py(inspection),verify_numbers.py(reconciliation), andverify_visual.py(image verification) outside the Agent environment. Ideal for integration into proprietary data pipelines or CI workflows to achieve automated data quality checks.
Best Practices: It is recommended to review the SKILL.md file before first use to understand workflow orchestration logic; when processing ultra-large Excel files, consider the reading performance of openpyxl and perform sampling verification first; for sensitive data operations, run the tool in a fully offline internal network environment to fully leverage its offline capabilities.
4. Pros and Cons Analysis
| Pros |
|---|
| Pre-check before processing: Use openpyxl to read the original cell structure, identify hidden issues like merged cells and mixed subtotal rows before pandas processes the data, preventing misjudgments caused by information loss and ensuring data quality from the source. |
| Total row as a checksum: Compare cleaned details against the built-in 'Total' row in the table, turning the original author's calculated true value into a free checksum, effectively identifying manual entry errors and discrepancies in calculation methods, achieving low-cost cross-validation. |
| Independent quality control check: Assign an agent not involved in the creation to recalculate from the raw data, verifying the reliability of conclusions and addressing systematic biases like 'all internal checks correct but overall wrong by a fiscal year,' enhancing delivery credibility. |
| Cross-Agent compatibility: Not tied to a specific platform, installable on Claude Code, Cursor, Codex, OpenClaw, Hermes, and pure standard library scripts can run independently, offering strong adaptability. |
| Minimal dependencies for offline use: Core dependencies are only openpyxl, eliminating the need for pandas, plotting libraries, LibreOffice, or internet connectivity. HTML reports with inline SVG can be opened offline, making it suitable for deployment in internal network environments. |
5. Comparative Analysis with Similar Tools
| Comparison Dimension | huashu-excel | Julius AI | ChatGPT Data Analysis |
|---|---|---|---|
| Product Form: | Open-source Agent Skill (MIT), installable on any platform such as Claude Code / Cursor / Codex | Proprietary SaaS product, web-based chat interface, requires account registration | Proprietary SaaS, integrated within ChatGPT conversation interface |
| Data Parsing: | Uses openpyxl to read original cell data, preserves merged cells, formatting, and data types | Parses files directly after upload, expands merged cells but loses formatting information | Parses files via Python environment after upload, partially retains formatting |
| Error Detection: | Eight-step workflow with multiple validation gates, refuses delivery on mismatches, actively reports errors | Outputs results via conversational flow, calculation errors typically pass silently, requiring user verification | Outputs via conversational flow, no built-in reconciliation mechanism, errors depend on user detection |
| Reconciliation Mechanism: | Cross-checks cleaned data against table "Totals" row, treats original author's calculated values as free validation checksums | No built-in cross-validation, totals row treated as regular data | No built-in cross-validation, requires user-initiated checks |
| Quality Control: | Assigns independent Agent to recalculate from raw data, specifically designed for adversarial validation | Single conversational path, no independent verification role | Single conversational path, no independent verification role |
| Chart Standards: | Selects encodings based on Cleveland & McGill perceptual precision hierarchy, enforces Y-axis starting at 0, rejects pie charts for >3 categories | Generates charts per instruction, no built-in anti-misleading rules | Generates charts per instruction, relies on prompt constraints |
| Report Output: | Self-contained HTML (inline SVG, offline accessible), native Excel, Word six-page narrative report | Embedded web charts + exports static images/PDF | Displays charts within conversation, exports PNG/PDF |
| Runtime Environment: | Depends only on openpyxl, fully offline/intranet capable, scripts can run independently outside Agent | Requires internet connection, data uploaded to third-party servers | Requires internet connection, data uploaded to OpenAI servers |
| Customizability: | Open-source modifiable, SKILL.md itself serves as methodology document, workflow adjustable per business needs | Black-box execution, users cannot modify underlying analysis processes | Black-box execution, only indirectly influence via prompts |
| Cost Model: | Completely free, no subscription fees, no usage limits | Free tier has limitations, Pro tier starts at $20/month | Plus subscription $20/month with usage limits |
Selection Recommendations: For teams requiring strict data auditing, sensitive data that cannot leave the intranet, and full control over analysis workflows, huashu-excel is the appropriate choice. Its MIT open-source license enables zero-cost deployment, with auditable and replayable workflows, making it particularly suitable for industries with extremely high data accuracy requirements such as finance, government, and healthcare, and can also serve as a quality inspection layer within existing data pipelines.
For individual users seeking zero-deployment cost and rapid interactive analysis experiences, Julius AI or ChatGPT Data Analysis offers greater convenience, though they require accepting the privacy tradeoff of uploading data to third-party servers and bearing the risk of undetected calculation errors. Microsoft 365 Copilot is ideal for teams already embedded in the Microsoft ecosystem with native Office report format requirements, but its analytical depth and reconciliation capabilities are relatively limited, making it more appropriate for lightweight data Q&A scenarios.
6. Editor's Summary
The value of huashu-excel lies not in introducing a new statistical algorithm, but in embedding engineering rigor into the workflow of AI Agents for data analysis. It distills an eight-step process from practical operations, with clearly defined deliverables and validation criteria for each step, transforming the previously opaque AI analysis process into a transparent, auditable, and replayable workflow. This "Process-as-Code" design philosophy demonstrates high originality among AI data analysis tools, offering the industry a replicable quality control paradigm.
From a practical perspective, the tool directly addresses three major pain points in LLM-based data analysis: structural misinterpretation, silent calculation errors, and unverifiable conclusions. Through three mechanisms - openpyxl-based raw cell reading, summary row reconciliation, and independent agent quality control - it effectively reduces error rates. Its particular suitability for roles sensitive to numerical accuracy in finance, auditing, and operations is evident. The MIT license and minimal dependencies further lower adoption barriers, while its offline intranet capability provides significant value to data-sensitive organizations concerned about data leakage risks.
In terms of target users, the tool is most appropriate for three categories: first, developers utilizing coding agents like Claude Code or Cursor, who can integrate it as a standard data processing module; second, data analysts frequently handling Excel reports, who can significantly reduce repetitive cleaning and verification tasks; third, business leaders requiring strict reliability standards for AI outputs, who can leverage the tool to generate audit-trail-enabled analysis reports. Users without programming experience will need to rely on the agent's natural language interface to fully realize the tool's potential.
Regarding development potential, the "Methodology-based Skill" approach represented by huashu-excel shows broad prospects. As the Agent ecosystem matures, encapsulating professional workflows as Skills may become an industry standard. The project's open-source nature positions it to attract community contributors, enabling expansion with additional industry templates and validation rules, gradually evolving into one of the foundational components of AI data analysis. The current version already possesses complete core capabilities, and continued iteration in performance optimization and visual configuration will further expand its application boundaries.
7. Application Scenarios
Daily Operations Standup Review: Automatically retrieve the previous day's operational data from the backend, complete the health check → cleaning → analysis → reconciliation workflow, and deliver a data fluctuation attribution report with methodology declarations before standup meetings. This enables teams to quickly identify root causes of growth or decline while reducing manual data preparation time.
Sales Performance Deep Dive Analysis: Feed it a million-line transaction detail sheet, automatically detect structural issues like new product revenue gaps and declining performance of legacy products, and generate an HTML report directly presentable to the Sales VP. Inline SVG charts function offline, enabling direct presentation during executive meetings and improving reporting efficiency.
Financial Budget Execution Review: Analyze municipal or corporate budget tables, identify "column naming criteria traps" where internal reconciliation appears correct but contains annual-level errors through external benchmark comparisons, and provide committee-grade explanations. This scenario leverages aggregate row reconciliation and independent quality control mechanisms to prevent budget execution misjudgments.
HR Compensation Fairness Diagnosis: Process tens of thousands of compensation surveys, calculate gender gaps after controlling variables like industry, education level, tenure, and city, and clearly delineate analytical boundaries of "what can be proven vs. what cannot be proven" to enhance the credibility and compliance of conclusions.
Data Cleaning and Audit Handover: Clean dirty tables and provide a replayable, auditable pandas cleaning script with logged row impact metrics for each step. This scenario is ideal for data teams during project handovers or compliance audits to ensure accountability and reusability.
8. FAQ
Q: What distinguishes huashu-excel from direct pandas analysis?
A: Pandas is a data processing tool without inherent data quality awareness. huashu-excel first uses openpyxl to read the original cell structure, identifying risks like merged cells and subtotal rows intermingled with data. It adds reconciliation and independent quality control steps after analysis, ensuring data accuracy and verifiable conclusions through process design.
Q: Which AI Agent platforms are supported?
A: Officially supports mainstream coding agents including Claude Code, Cursor, Codex, Kimi Code, OpenClaw, and Hermes. Installation paths vary slightly by platform: Claude Code uses ~/.claude/skills/, Codex/Kimi Code uses ~/.agents/skills/, and for project-level usage, follow the repository directory structure.
Q: How is data privacy protected?
A: Core dependencies only include openpyxl, requiring no internet connection. It can operate in fully isolated intranet environments. All data reading, cleaning, analysis, and report generation occurs locally, eliminating risks of third-party server uploads. Ideal for handling sensitive business data.
Q: What Excel file sizes can be processed?
A: Limited by openpyxl's reading mechanism, worksheets with up to one million rows can be handled normally. However, loading times for large files will increase significantly. For massive datasets, we recommend sampling or chunked preprocessing before analysis.
Q: What report formats are available?
A: Three formats are supported: self-contained HTML (with inline SVG for offline viewing), native Excel (charts dynamically linked to data), and a six-page Word narrative report. These are optimized for web sharing, data interactivity, and formal presentations respectively, allowing users to select based on needs.
Q: What if the subtotal rows themselves are incorrect?
A: The reconciliation process aims to detect discrepancies between detailed data and totals. If subtotal rows contain errors, the system will trigger alerts. Users can then cross-reference with external benchmark data to determine which standard takes precedence. This mechanism explicitly surfaces "assumptions made by the original spreadsheet author" for user verification.
9. Project Links
- GitHub Repository: https://github.com/alchaincyf/huashu-excel (MIT-licensed open source, includes complete Skill definitions, Python scripts, and usage documentation)
Related AI Model Articles
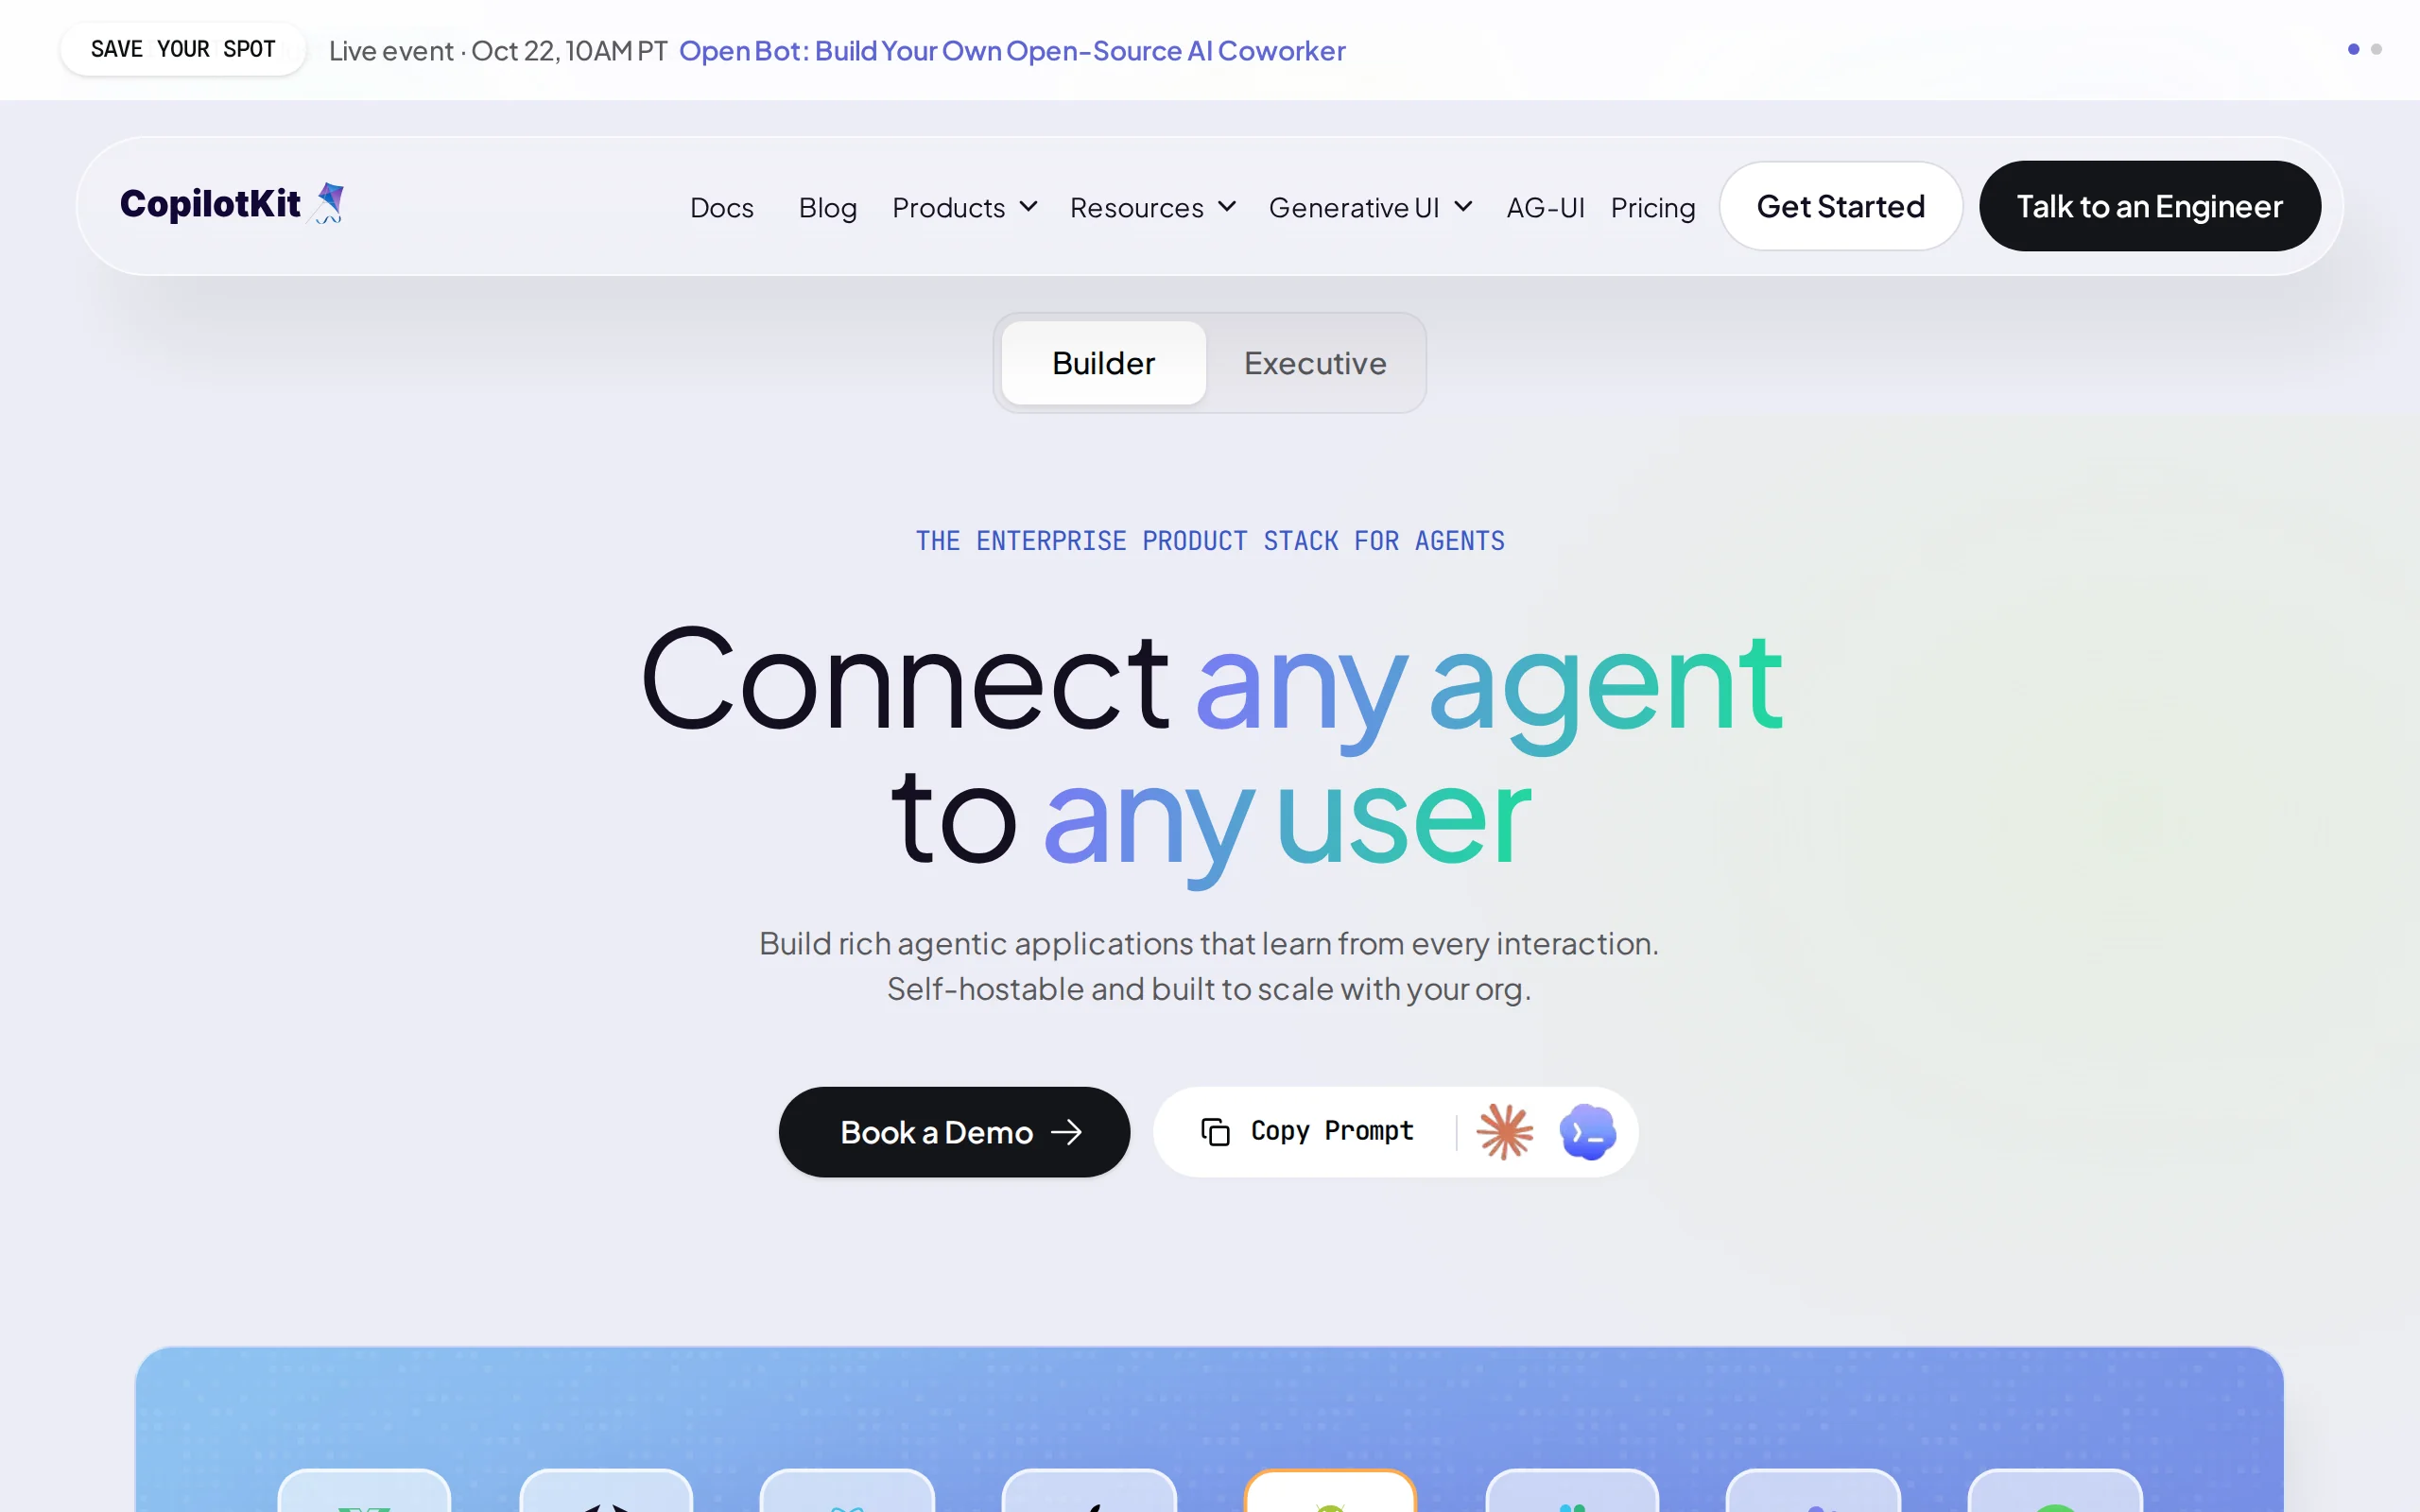
OpenMuse – CopilotKit Open-Source Personal AI Assistant
OpenMuse is an open-source personal AI assistant project developed by the CopilotKit team. Its core design philosophy is "giving an Agent a computer" — by combining a persistent browser, optional Linu...
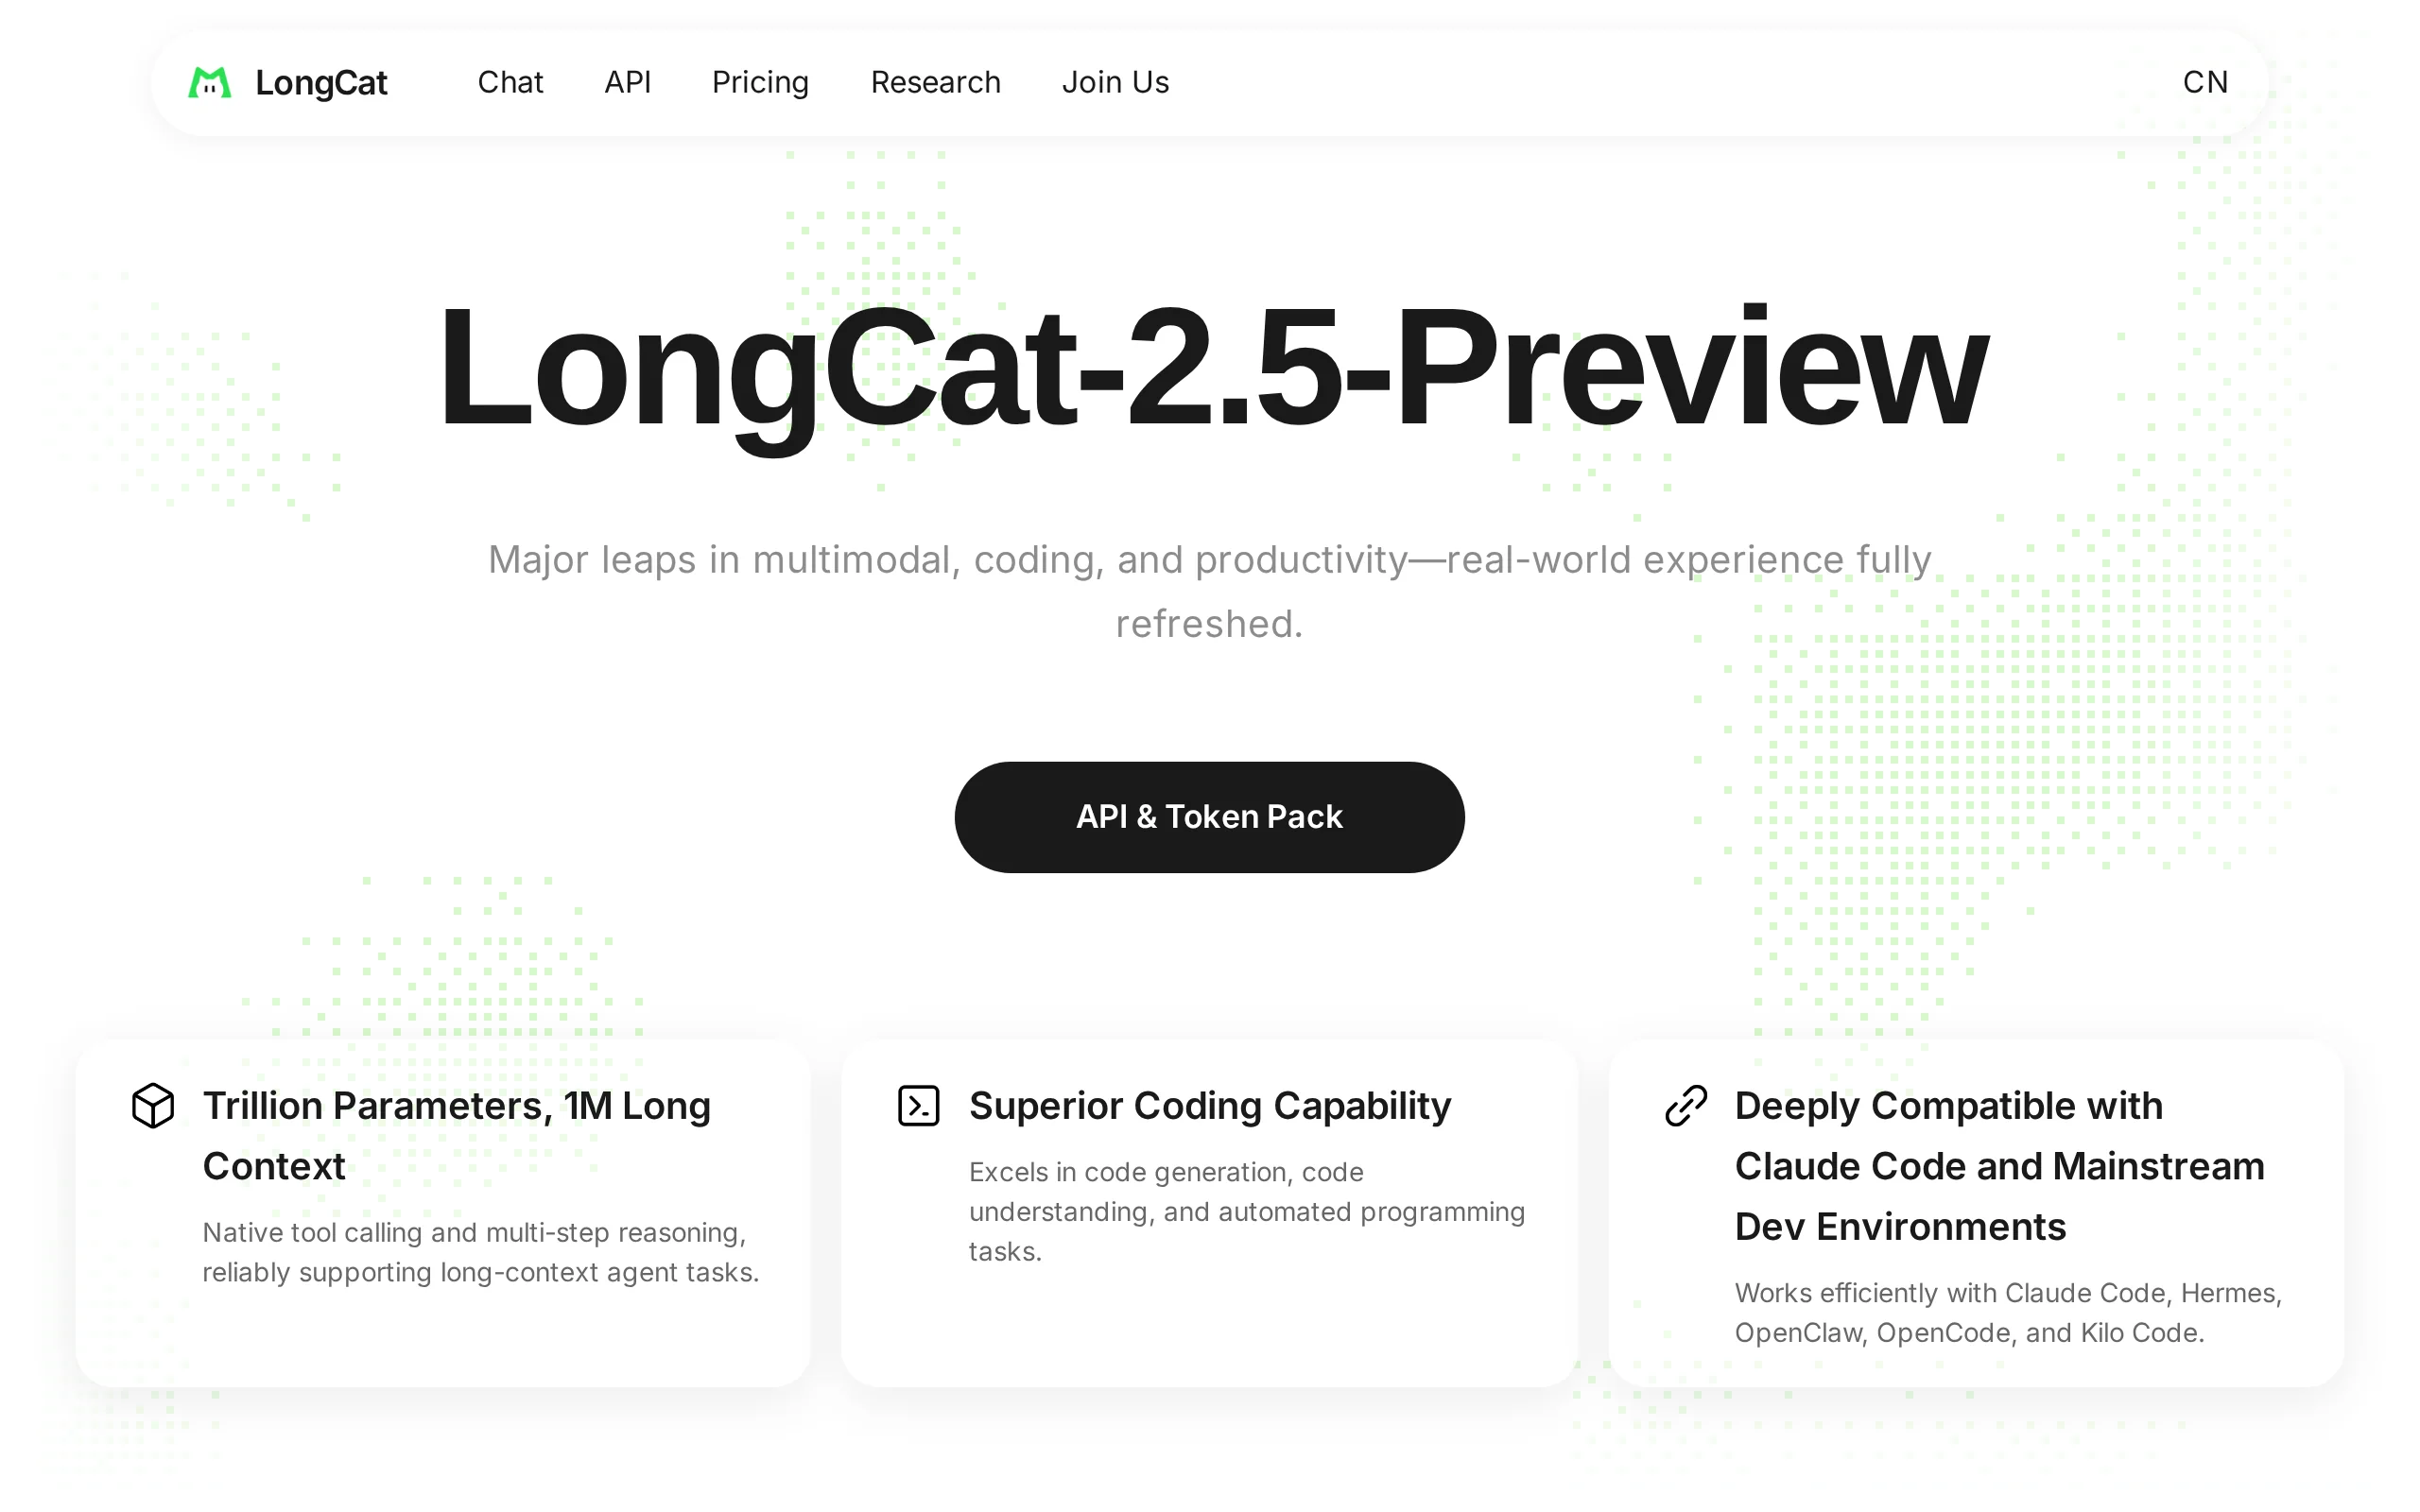
In-Depth Review of Longcat-2.5-preview: Meituan's Next-Generation Multimodal Long-Range Agent Model
LongCat-2.5-preview is Meituan's latest next-generation large model. Building upon the 1.6T total parameters, approximately 48B active parameters, and native 1M token context of LongCat-2.0, it marks ...
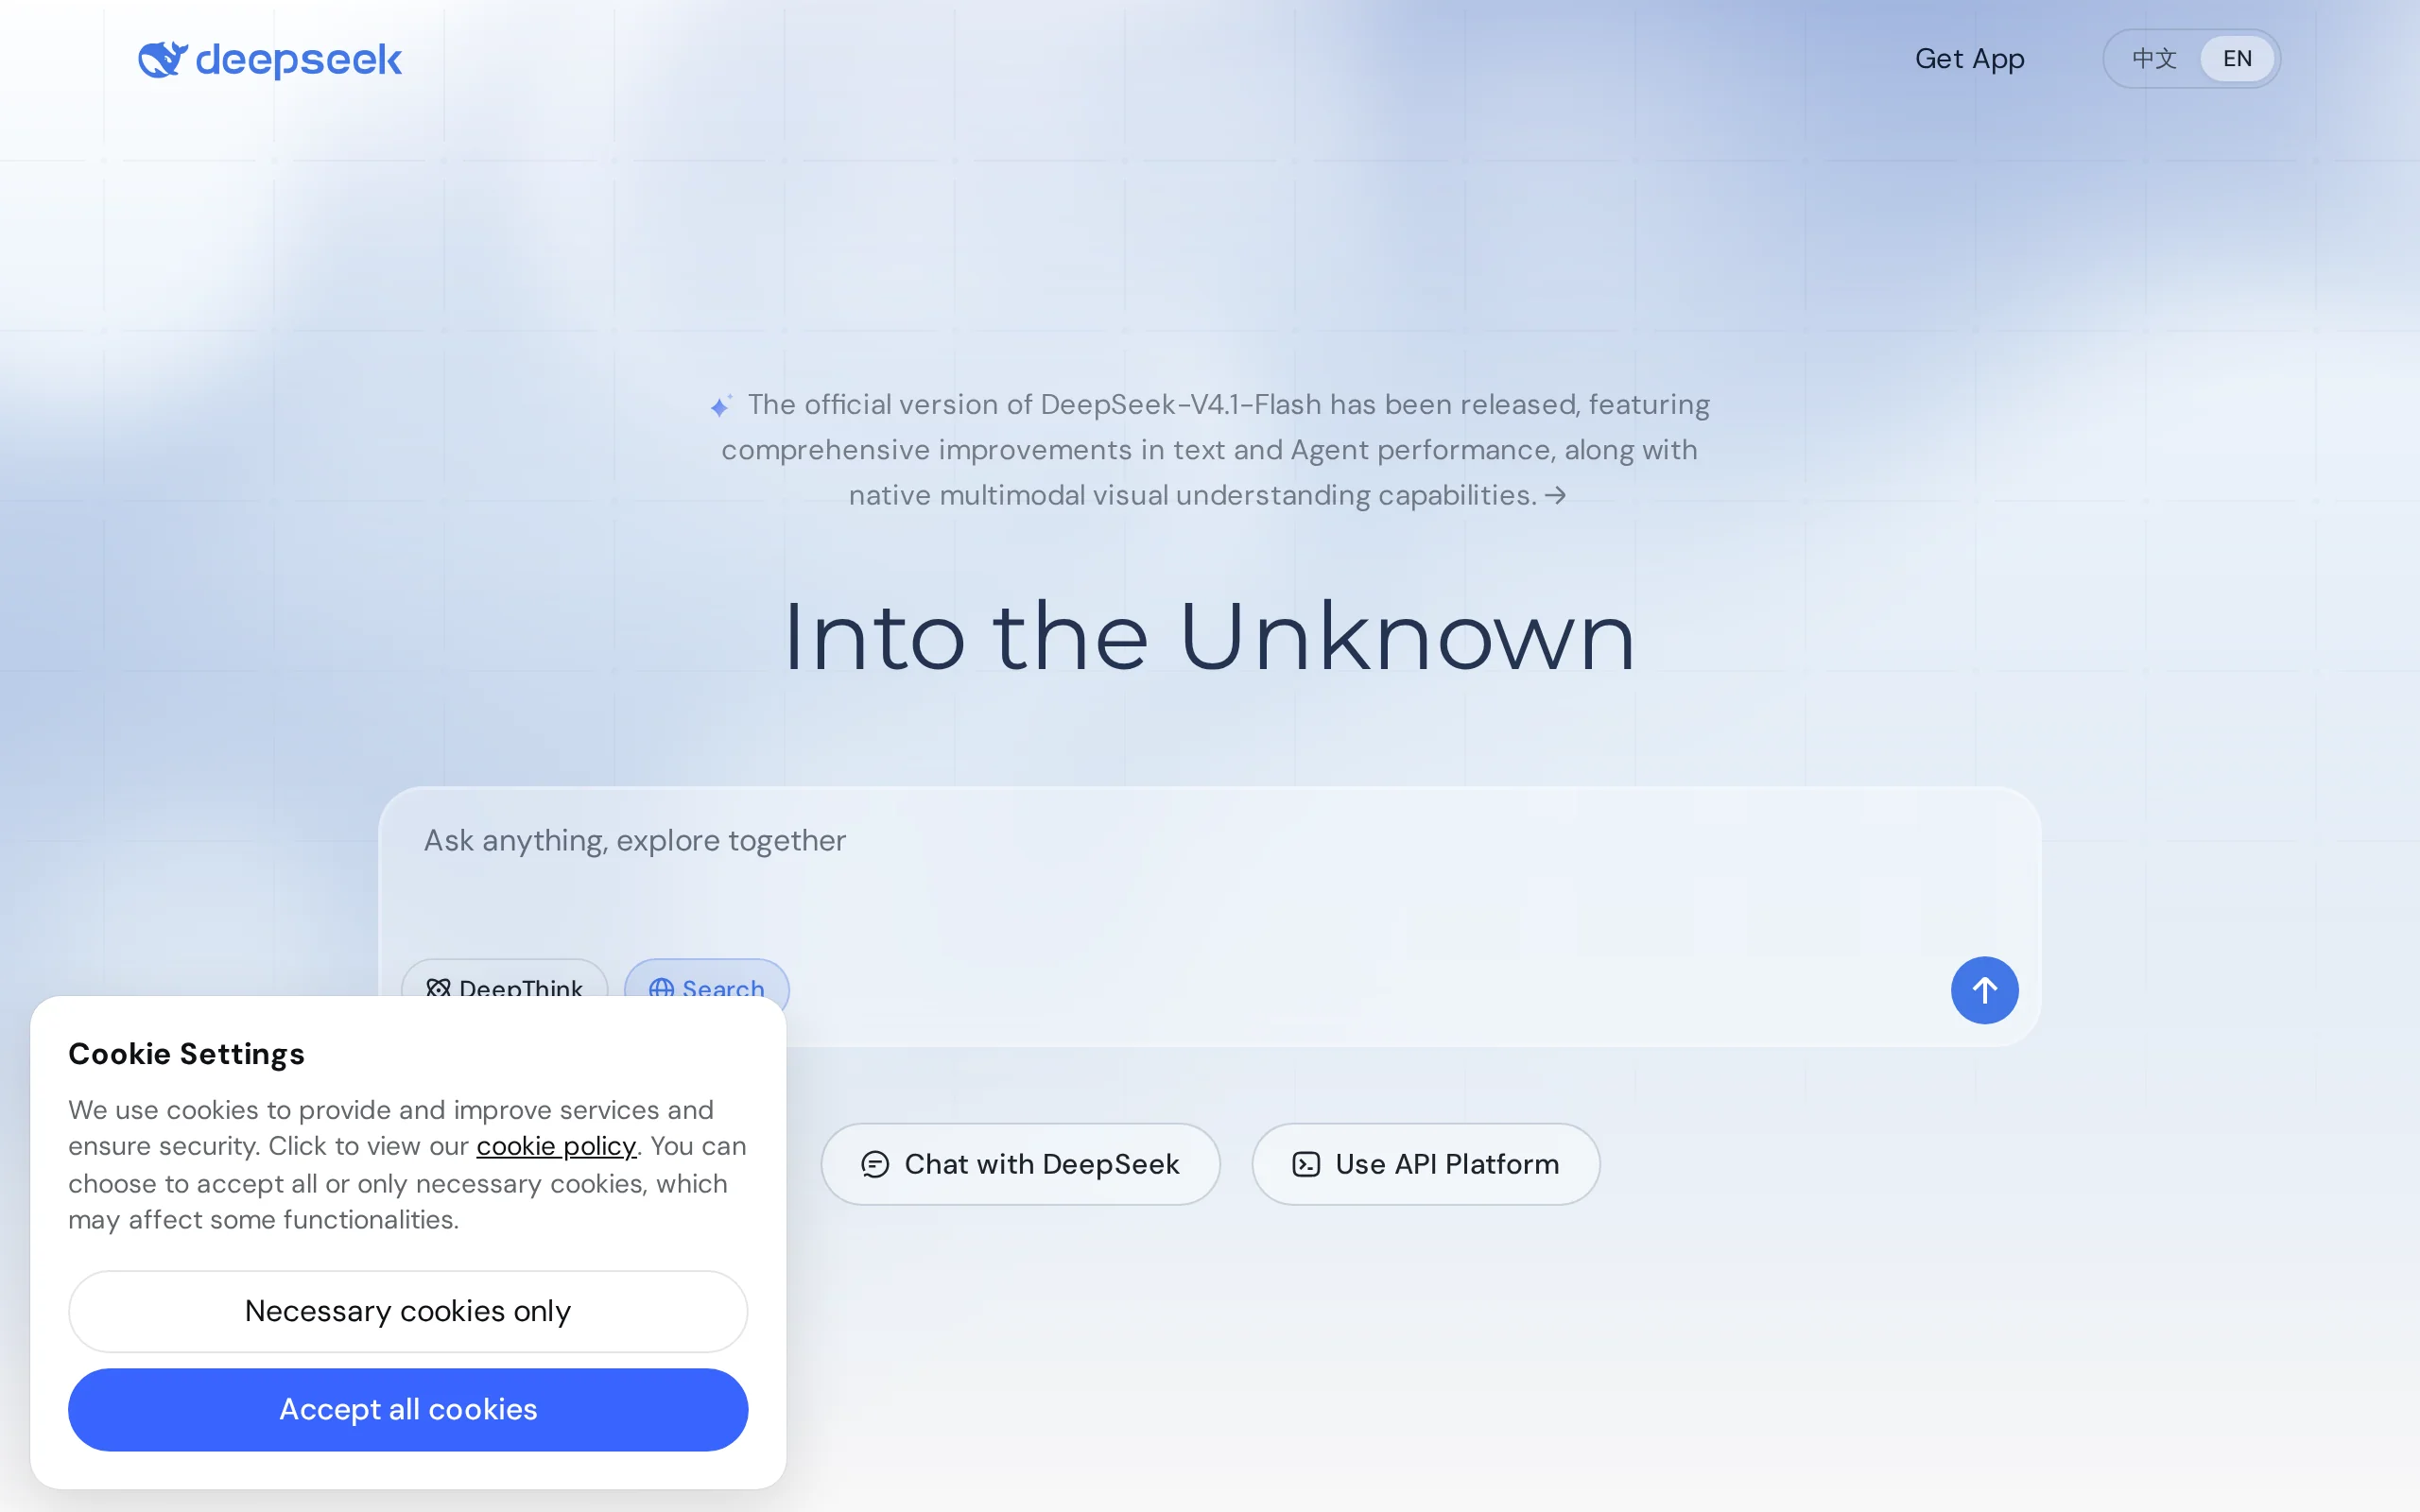
Review of DeepSeek Harness Desktop: How the Official GUI Client Lowers the Bar for Agent Usage
DeepSeek Harness Desktop is the official graphical client launched by DeepSeek, designed to provide a visual interface for the originally command-line-based DeepSeek Harness framework. After users log...

Step Code – In-Depth Review of StepFun's Open-Source Terminal Programming Agent
Step Code is an open-source terminal programming agent launched by StepFun, licensed under the MIT License, which allows developers to complete the full workflow of code writing, debugging, execution,...
© All Rights Reserved. Some content on this site is partially generated by AI with human review.